spectrum のインストールと動作確認(スペクトログラム,PSD による Yule Walker 法)(Python を使用)(Windows 上)
スペクトログラムは,周波数と時間を,縦横の軸とするグラフ.強度を色や明るさで表すことが多い.
【文献】
Cokelaer et al, (2017), 'Spectrum': Spectral Analysis in Python, Journal of Open Source Software, 2(18), 348, doi:10.21105/joss.00348
【関連する外部ページ】
- specurum の GitHub のページ: https://github.com/cokelaer/spectrum
- spectrum の公式ドキュメント: http://pyspectrum.readthedocs.io/
前準備
Python 3.12,Git のインストール(Windows 上)
Pythonは,プログラミング言語の1つ. Gitは,分散型のバージョン管理システム.
【手順】
- Windows で,管理者権限でコマンドプロンプトを起動(手順:Windowsキーまたはスタートメニュー >
cmdと入力 > 右クリック > 「管理者として実行」)。次のコマンドを実行
次のコマンドは,Python ランチャーとPython 3.12とGitをインストールし,Gitにパスを通すものである.
次のコマンドでインストールされるGitは 「git for Windows」と呼ばれるものであり, Git,MinGW などから構成されている.
reg add "HKLM\SYSTEM\CurrentControlSet\Control\FileSystem" /v LongPathsEnabled /t REG_DWORD /d 1 /f
REM Python, Git をシステム領域にインストール
winget install --scope machine --id Python.Python.3.12 --id Python.Launcher --id Git.Git -e --silent
REM Python のパス
set "INSTALL_PATH=C:\Program Files\Python312"
echo "%PATH%" | find /i "%INSTALL_PATH%" >nul
if errorlevel 1 setx PATH "%PATH%;%INSTALL_PATH%" /M >nul
echo "%PATH%" | find /i "%INSTALL_PATH%\Scripts" >nul
if errorlevel 1 setx PATH "%PATH%;%INSTALL_PATH%\Scripts" /M >nul
REM Git のパス
set "NEW_PATH=C:\Program Files\Git\cmd"
if exist "%NEW_PATH%" echo "%PATH%" | find /i "%NEW_PATH%" >nul
if exist "%NEW_PATH%" if errorlevel 1 setx PATH "%PATH%;%NEW_PATH%" /M >nul
【関連する外部ページ】
- Python の公式ページ: https://www.python.org/
- Git の公式ページ: https://git-scm.com/
【サイト内の関連ページ】
【関連項目】 Python, Git バージョン管理システム, Git の利用
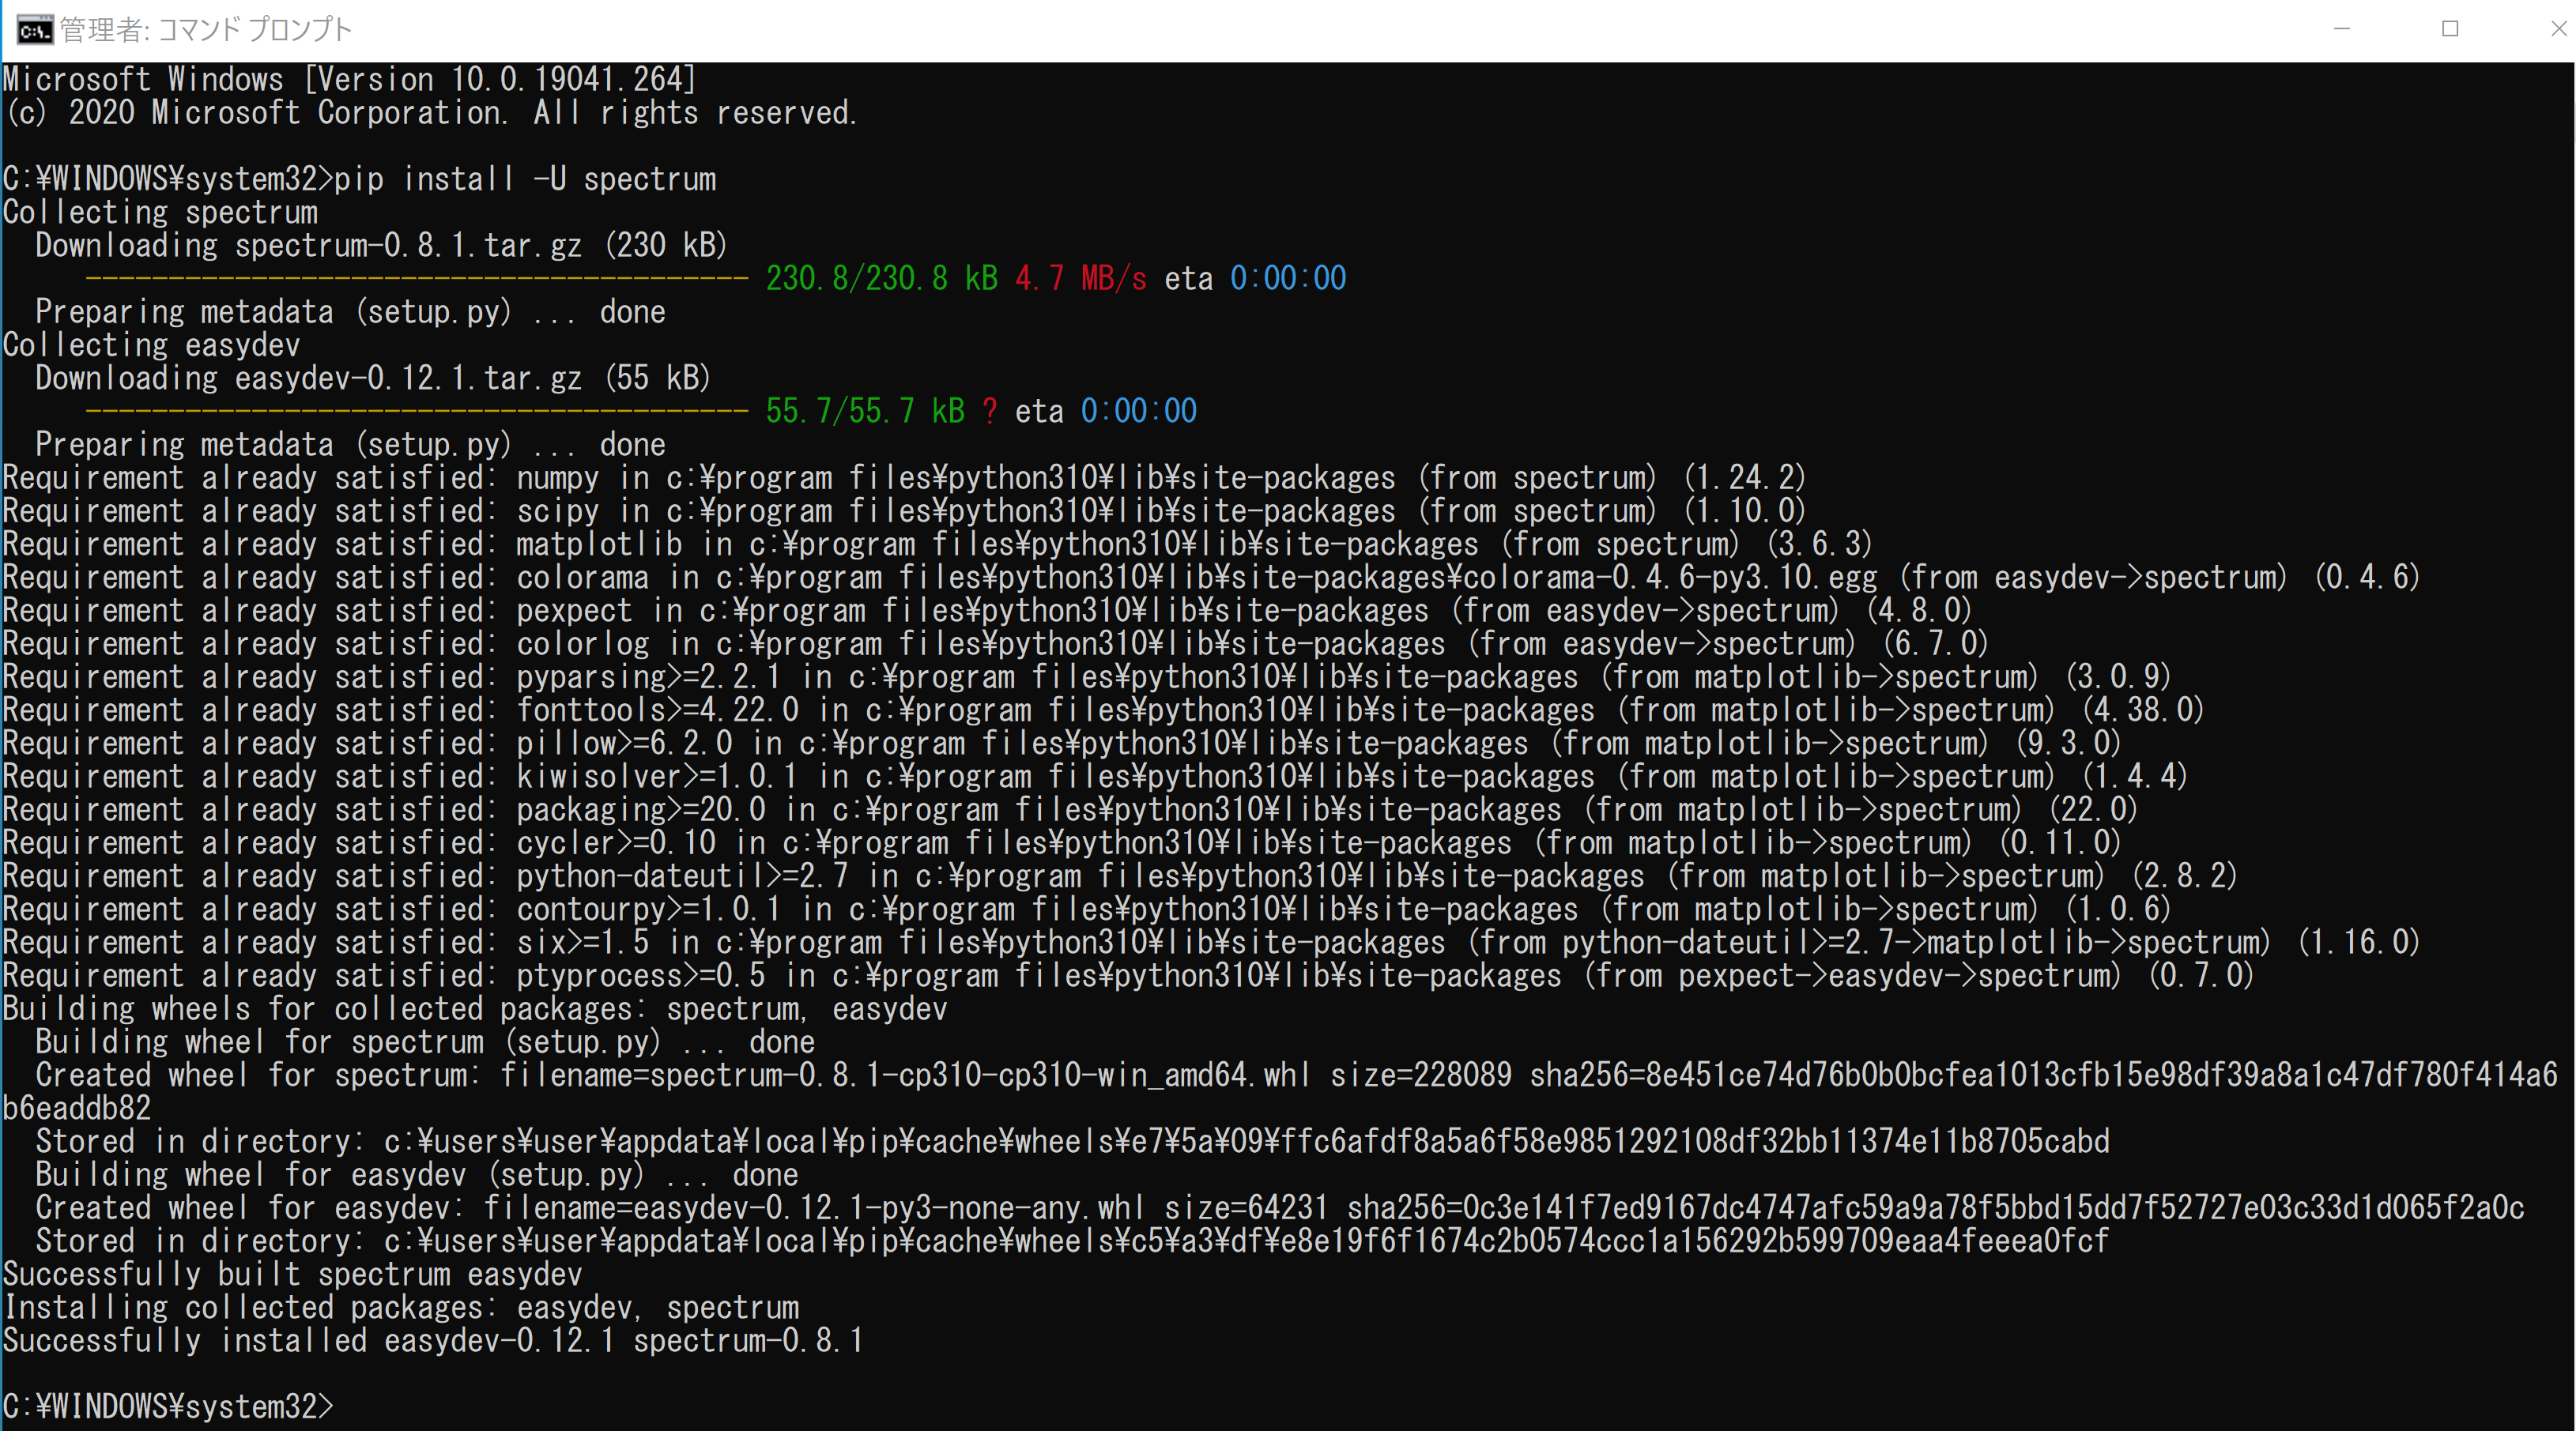
parselmouth のインストール(Windows 上)
- Windows で,管理者権限でコマンドプロンプトを起動(手順:Windowsキーまたはスタートメニュー >
cmdと入力 > 右クリック > 「管理者として実行」)。 - pip を用いてインストール
pip install -U spectrum
動作確認
.wav 形式のファイルからスペクトログラムを表示. スペクトログラムは,周波数と時間を,縦横の軸とするグラフ.強度を色や明るさで表すことが多い.
次で公開されているプログラムを使用
https://github.com/cokelaer/spectrum/blob/master/examples/plot_spectrogram.py
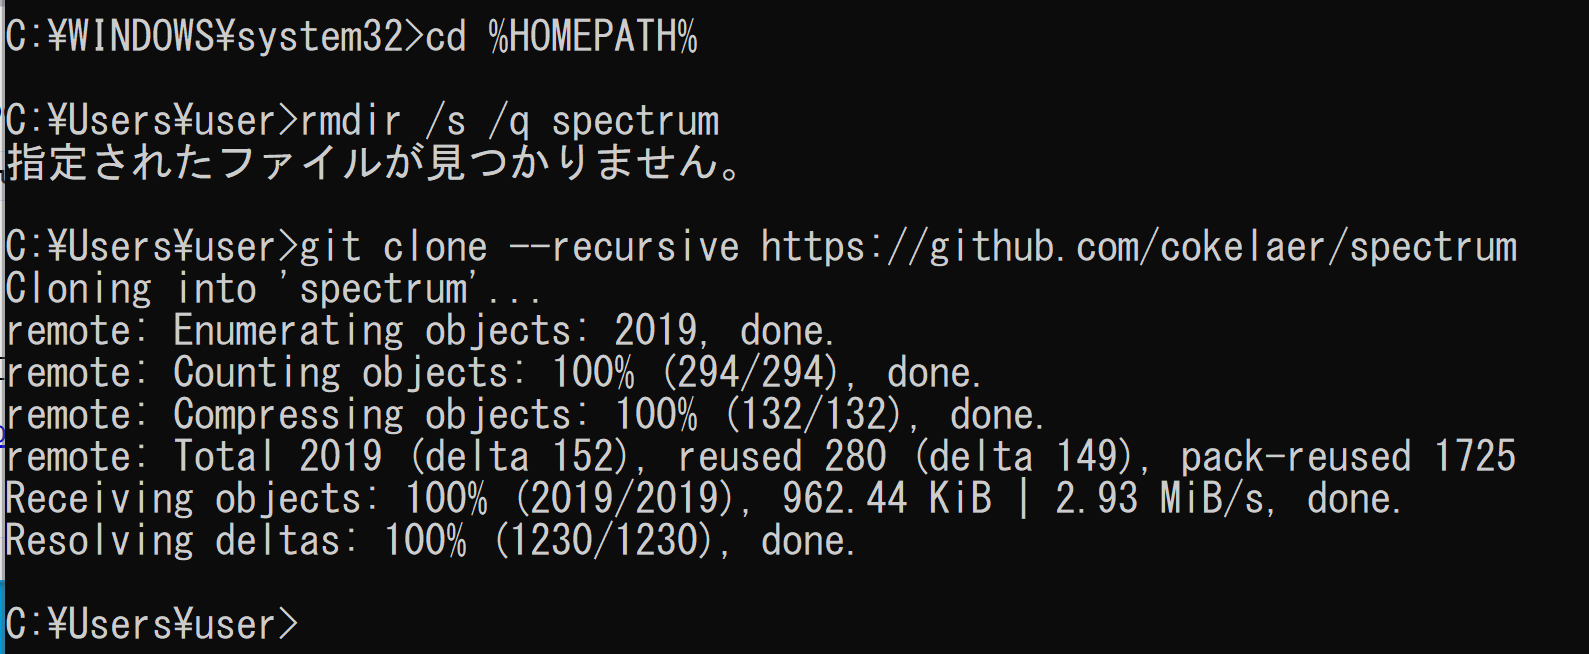
- Windows で,管理者権限でコマンドプロンプトを起動(手順:Windowsキーまたはスタートメニュー >
cmdと入力 > 右クリック > 「管理者として実行」)。 - 公式ページから parselmouth のファイルをダウンロード
cd /d c:%HOMEPATH%
rmdir /s /q spectrum
git clone --recursive https://github.com/cokelaer/spectrum
- numpy, matplotlib, seaborn のインストール
pip install -U numpy matplotlib seaborn

- スペクトログラムの表示
次のページで公開されているプログラムを使用している.
https://github.com/cokelaer/spectrum/blob/master/examples/plot_spectrogram.py
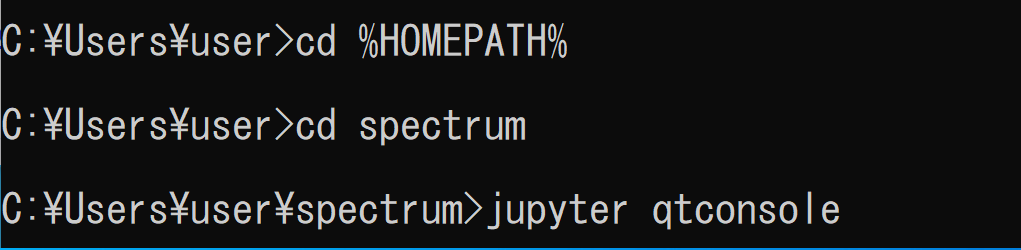
次のコマンドを実行
cd /d c:%HOMEPATH%
cd spectrum
jupyter qtconsole
- Python プログラムの実行
Python プログラムの実行
- Windows では python (Python ランチャーは py)
- Ubuntu では python3
Python 開発環境(Jupyter Qt Console, Jupyter ノートブック (Jupyter Notebook), Jupyter Lab, Nteract, Spyder, PyCharm, PyScripterなど)も便利である.
Python のまとめ: 別ページ »にまとめ
python
from spectrum import Spectrogram, readwav
data, samplerate = readwav("src/spectrum/data/dolphins.wav")

p = Spectrogram(data, ws=128, W=4096, sampling=samplerate)
p.periodogram()
p.plot()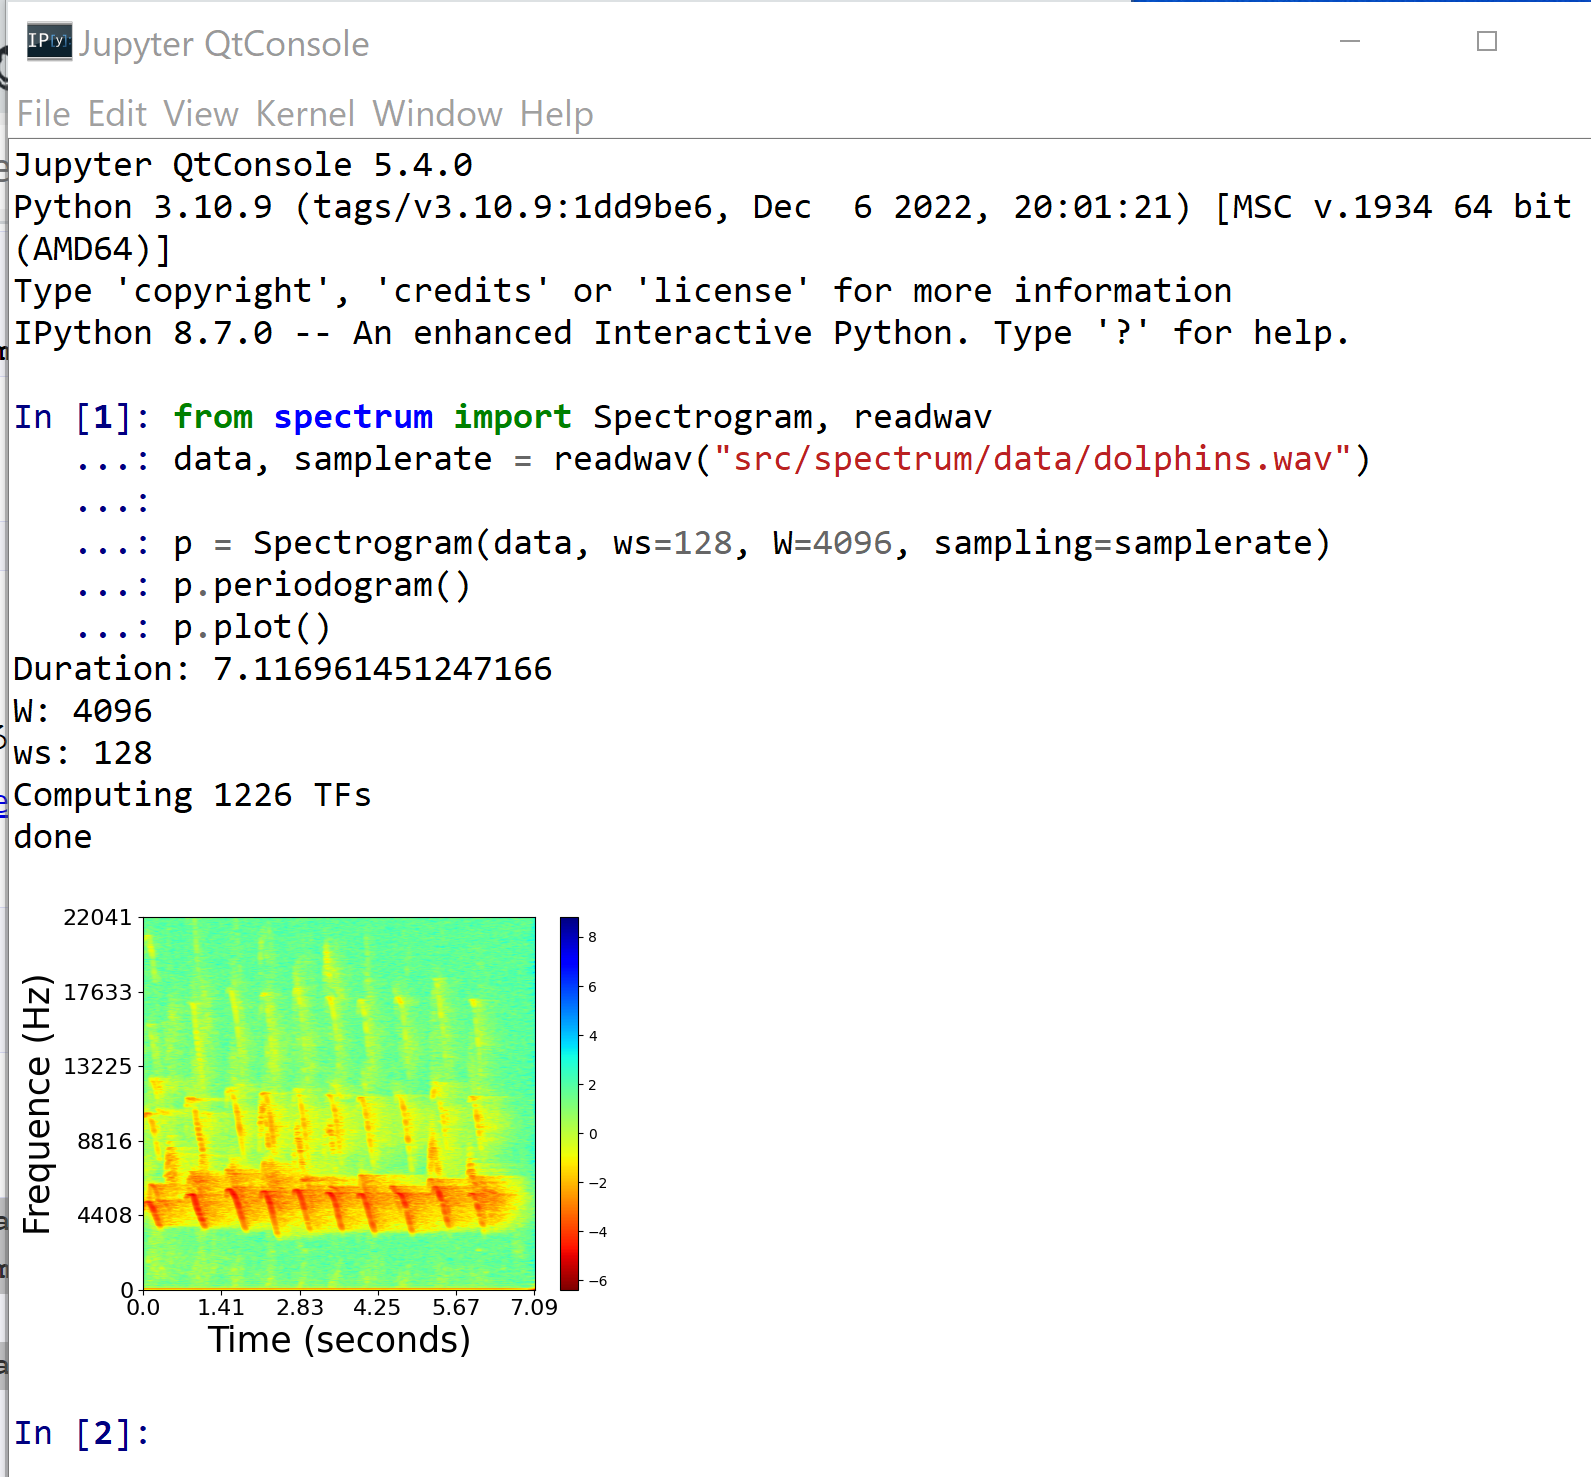
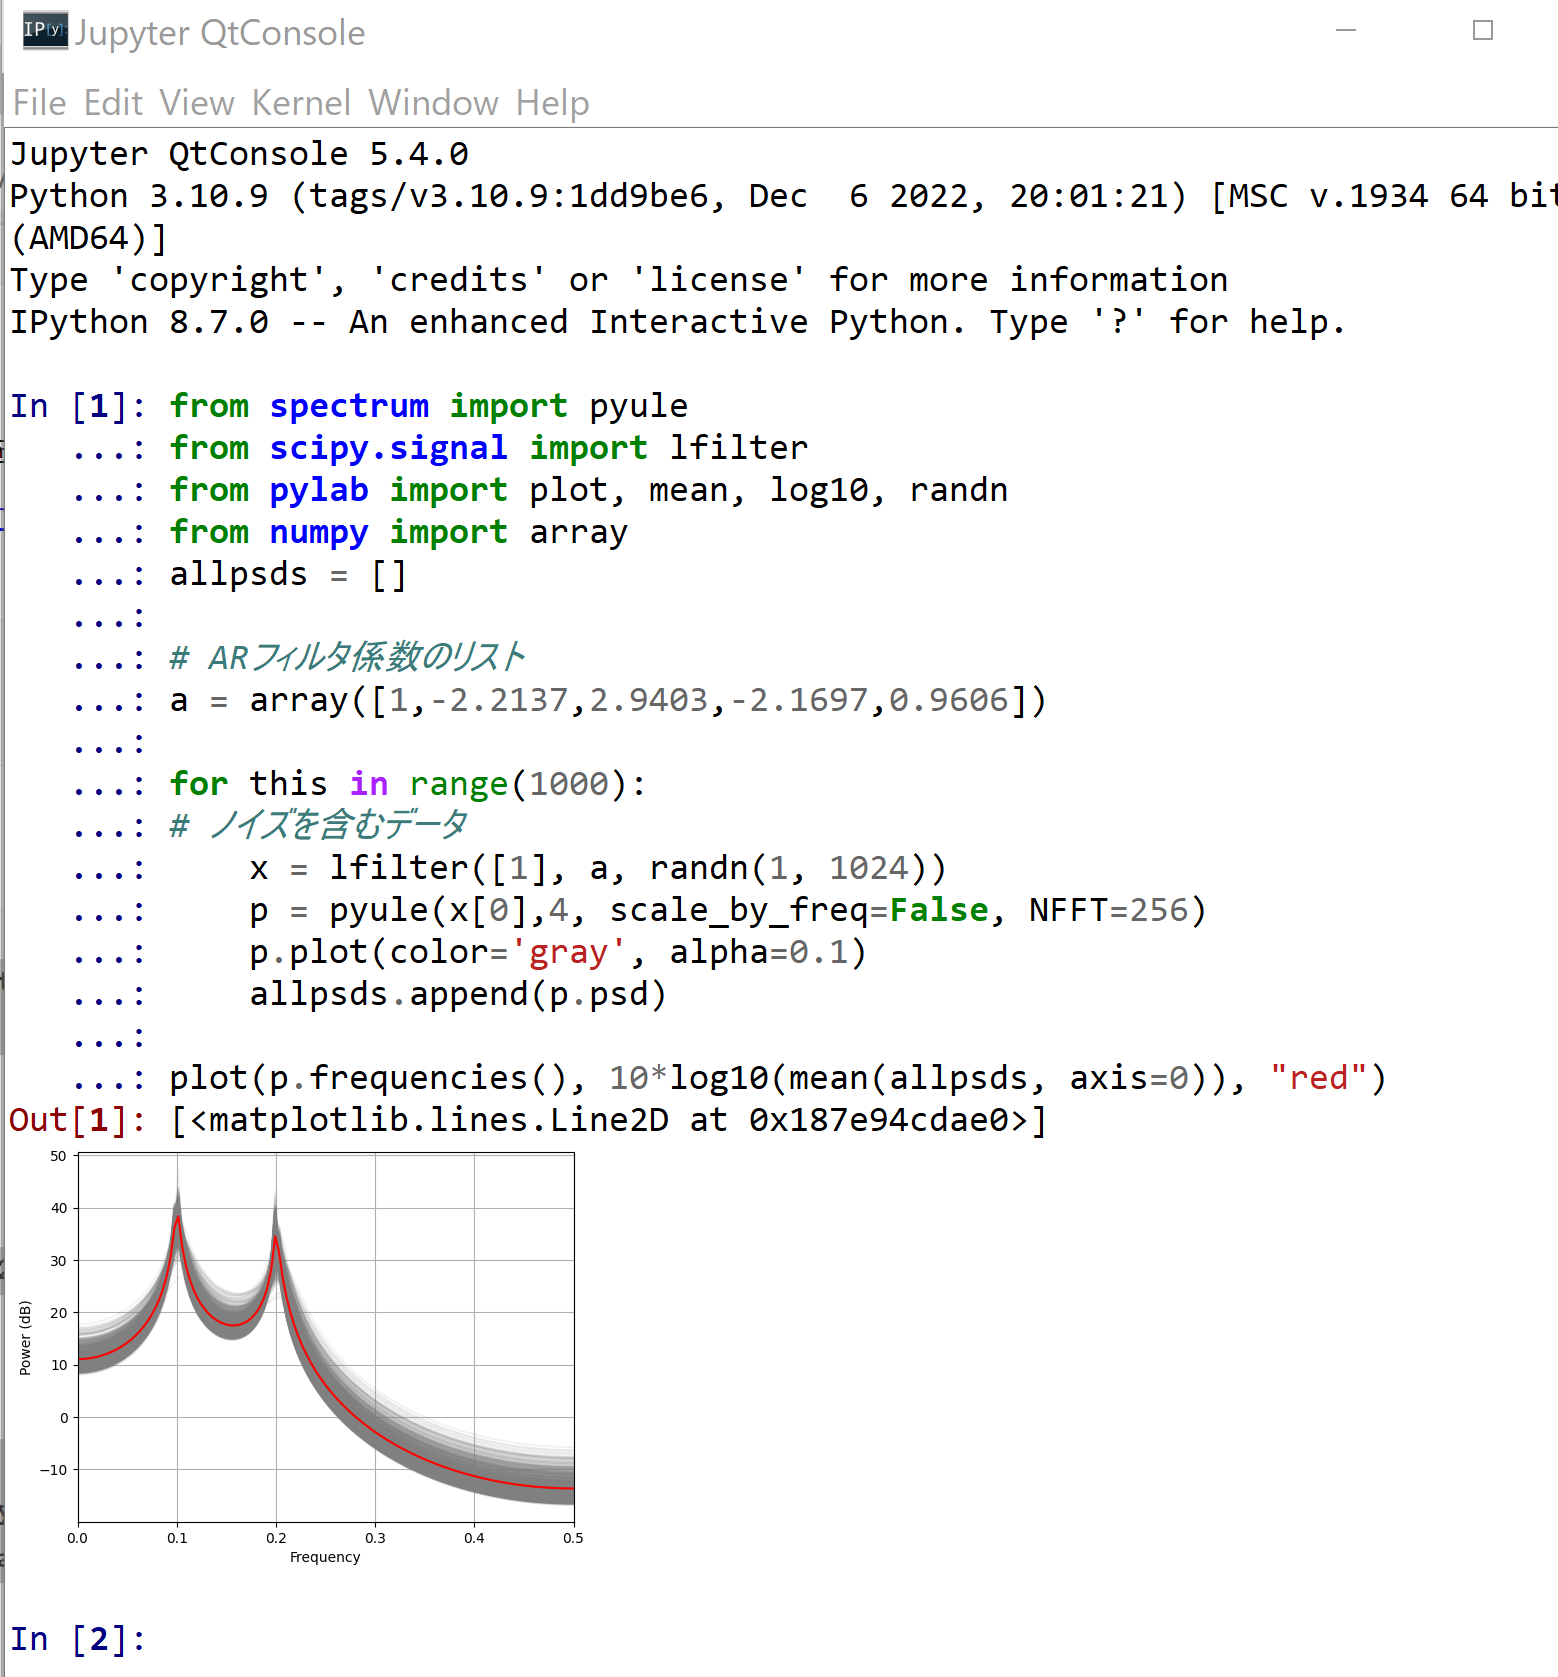
- PSD による Yule Walker 法
次のページで公開されているプログラムを使用している.
https://github.com/cokelaer/spectrum/blob/master/examples/plot_yule.py
次のコマンドを実行
cd /d c:%HOMEPATH%
cd spectrum
jupyter qtconsole
Python プログラムを実行する
from spectrum import pyule
from scipy.signal import lfilter
from pylab import plot, mean, log10, randn
from numpy import array
allpsds = []

# ARフィルタ係数のリスト
a = array([1,-2.2137,2.9403,-2.1697,0.9606])

for this in range(1000):
# ノイズを含むデータ
    x = lfilter([1], a, randn(1, 1024))
    p = pyule(x[0],4, scale_by_freq=False, NFFT=256)
    p.plot(color='gray', alpha=0.1)
    allpsds.append(p.psd)

plot(p.frequencies(), 10*log10(mean(allpsds, axis=0)), "red")